MoORa (Modelling Of Radiations) is a user-friendly and simple to use software developed by Artenum that helps modelling the radiations transport using Geant4, a Monte-Carlo numerical kernel.
As of today, MoORa is interfaced with the GRAS tool (Geant4 Radiation Analysis for Space) developed by ESA.
You can find more information on MoORa in our DOP (Detailed Offer and Pricing) or by contacting us.
Contents
Interactive inputs setting
A radiation transport code – such as GRAS – requires several settings that can be easily set from within MoORa.
Geometrical system definition
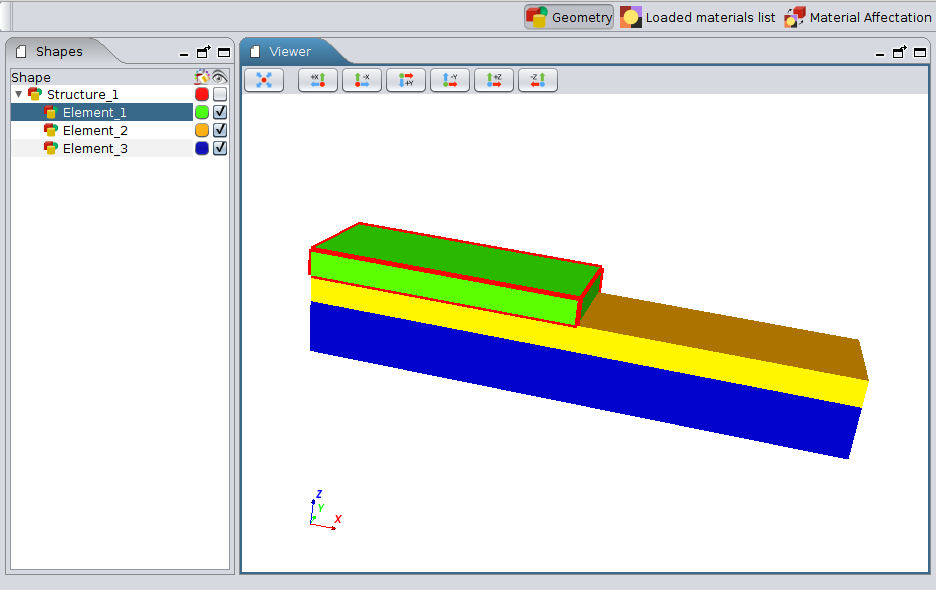
The GDML format is the geometrical system definition language of Geant4 and that can be used to define the system geometry and materials with GRAS. It is possible to import a GDML file inside MoORa to use as geometrical description for the simulation. This file can be visualised in 3D within MoORa.
To define the geometry and the materials of the system, EDGE (ExtendeD Gdml Editor) can be used. It is an interactive and easy to use CAD tool which is part of the SpaceSuite offer.
Space environment setting
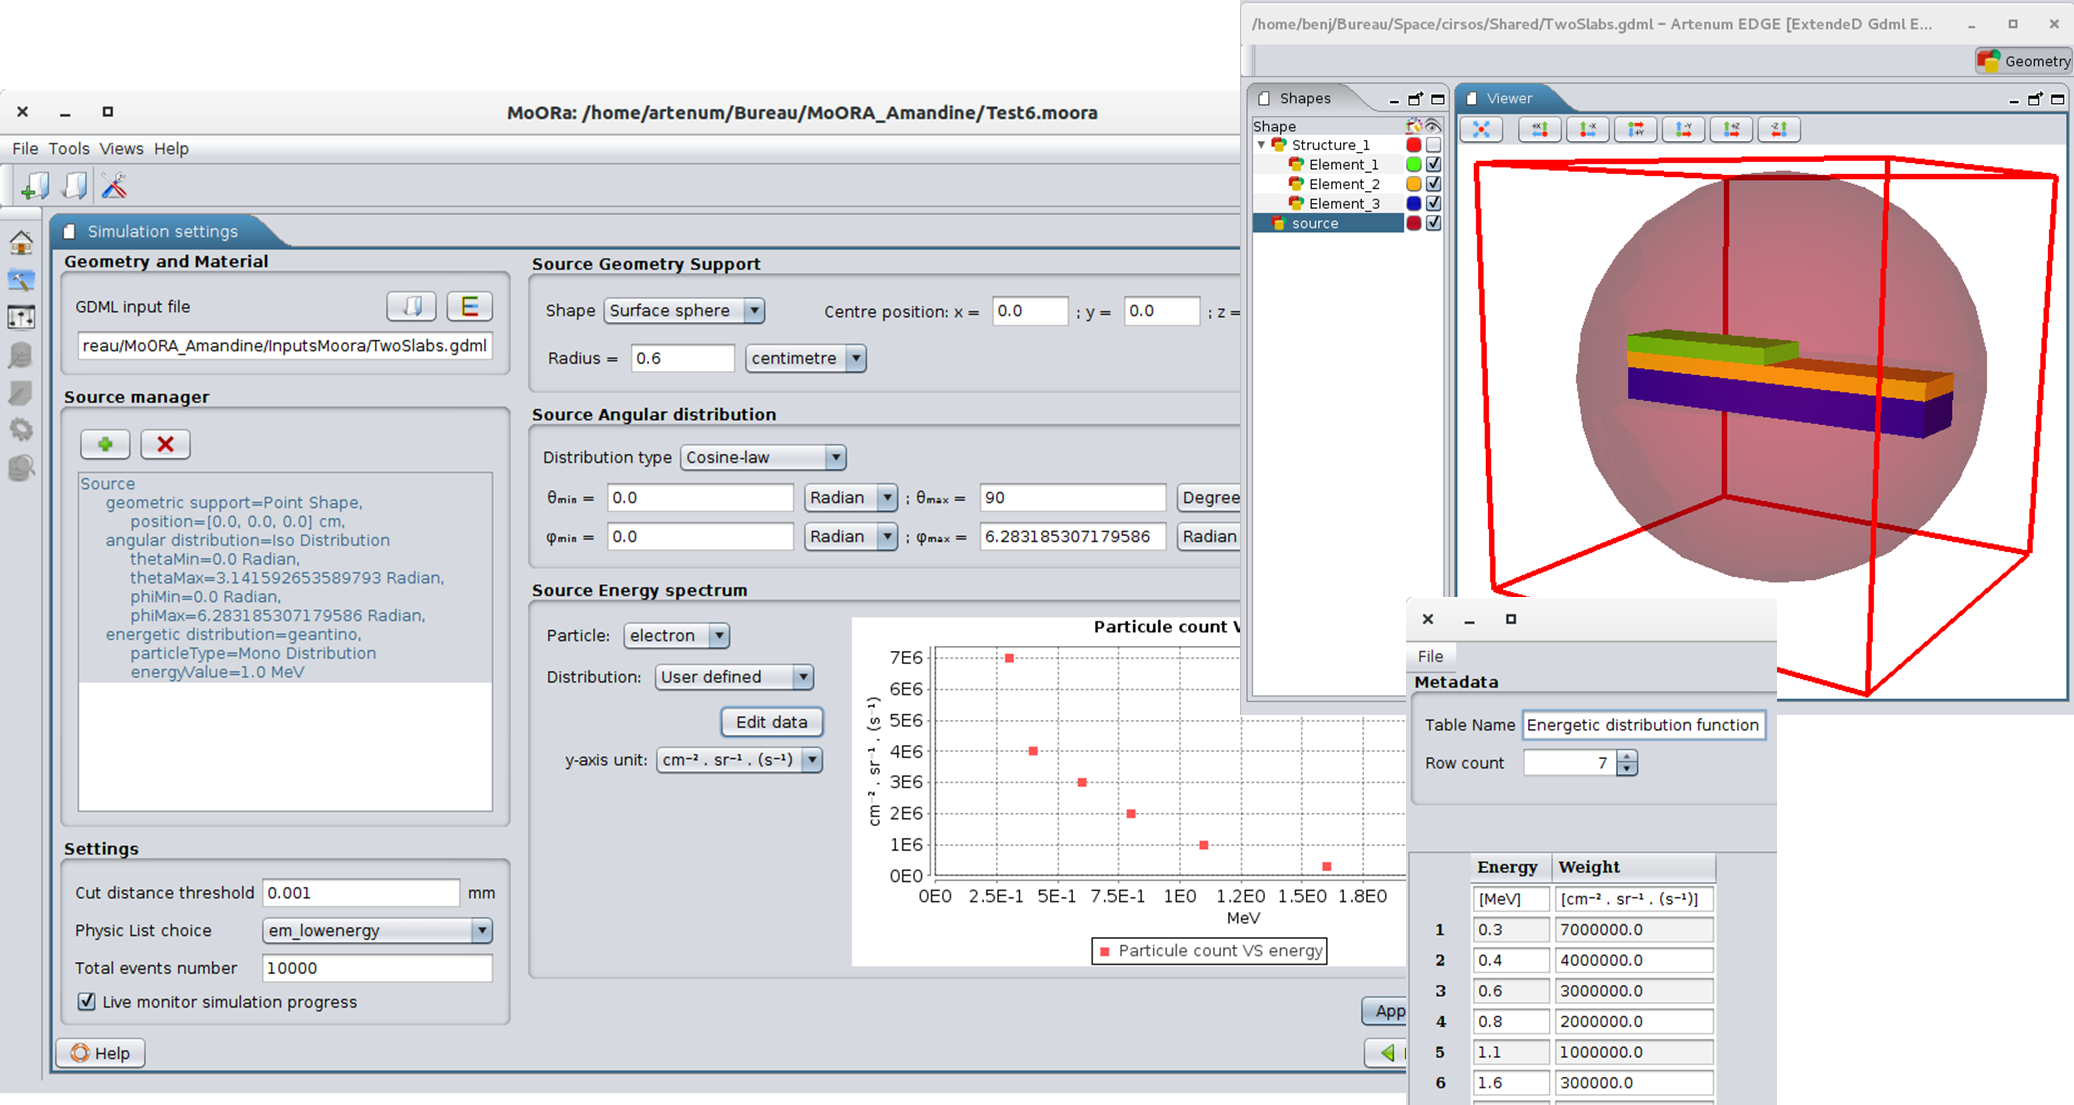
Various settings are needed to take into account the space environment for the simulation. An interactive source definition panel helps the user to set-up the source of particles easily. It is also possible to visualise source geometry in 3D inside the system’s geometry.
One important setting is the energy distribution of the particles: inside MoORa, the user can either use pre-defined energy spectrum formulas (from Geant4) or import it from external tools/database as a user-defined spectrum (from exported files of SPENVIS or from .csv files).
Simulation settings
MoORa helps the user to choose the main characteristics of the simulation such as for example the number of emitted particles or the Geant4 physics to use to model precisely the interactions between particles and matters.
On demand outputs
Depending of the aim of the simulation, the user can choose the wanted outputs, avoiding generating non-pertinent results.
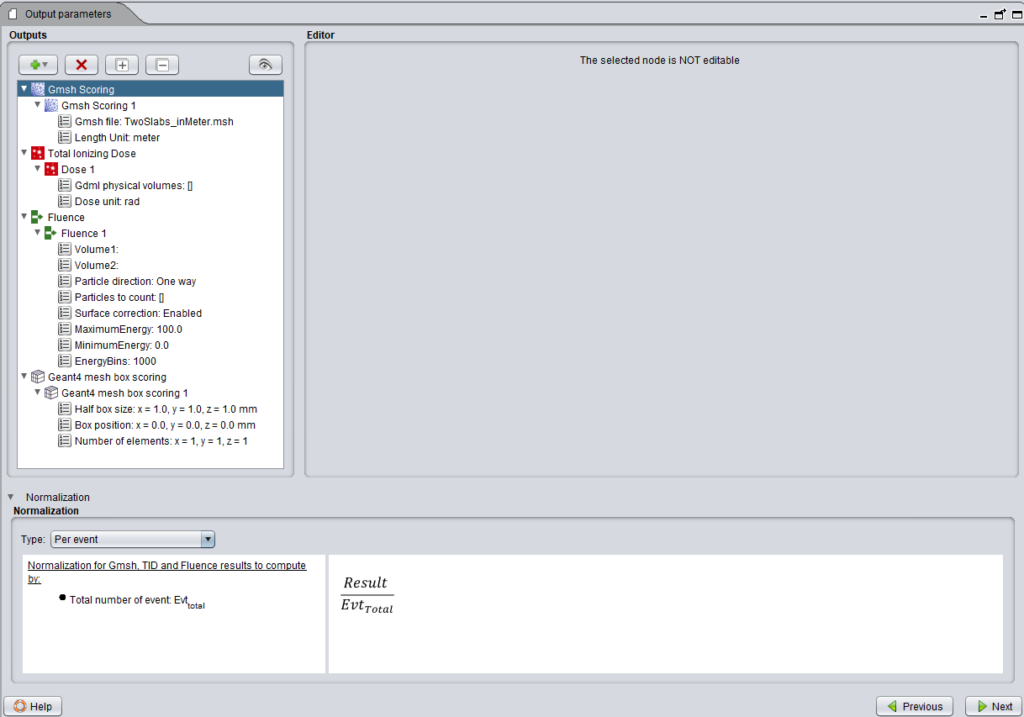
Total ionizing dose (TID)
The user can choose to calculate the Total Ionizing Dose (TID) inside an element defined in the GDML geometrical description of the simulation. The dose represents an energy quantity by mass unit. It is useful to assess the sensitivity of a system in regards to the radiations transport.
The TID can be calculated inside one shape or inside several of them.
Gmsh scoring
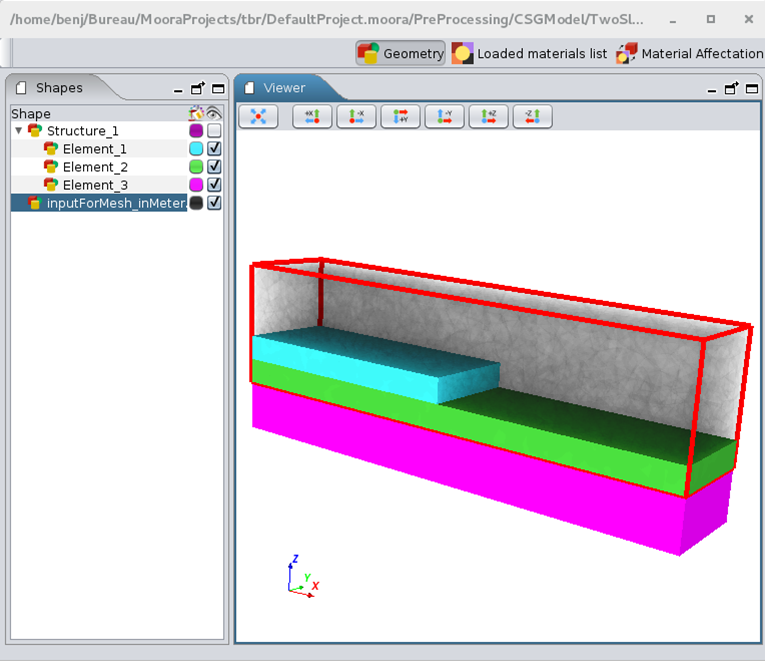
The user can add one or several Gmsh volume mesh files (.msh) in order to obtain a scoring of the GRAS results on the given meshes. Three types of results are computed on a meshing: deposited charge, deposited dose and deposited energy. Thus, the user will obtain at the end of the simulation a meshing were the value of the deposited dose for example will be calculated on each tetrahedron of the meshing.
The use of a Gmsh scoring can be interesting for the user especially if he wishes to use MoORa results as inputs of another physical study, such as an internal charging analysis with SPIS-IC for example.
It is possible to visualise the relative position of the selected mesh file inside the the geometry directly in this panel.
Energy
The user can choose to calculate the deposited energy inside an element defined in GDML. It
is useful to assess the sensitivity of a system in regards to the radiations transport.
The energy is calculated in MeV. The energy can be chosen to be calculated inside one shape or for a set of shapes.
Fluence
The user can choose to calculate the fluence between two shapes defined in GDML. The fluence is computed by counting the particle going only from one GDML shape to another one or in both directions.
Various particles can be selected to be counted for fluence computation between electrons, protons, neutrons, gammas and ions. The fluence can also be computed for particles having an energy inside a provided range.
Geant4 mesh box scoring
The user can choose to calculate for each trajectory the deposited energy in each cubic
Geant4 mesh element in a specific bounding box volume.
Normalization
It is possible to select output normalization options applicable to most of the outputs (Gmsh mesh scoring, TID, energy and fluence). It is possible to select between:
- No normalization
- Per event: normalization by the total number of particle modelled
- Source shape surface: normalization by the total number of particle modelled and by the surface of the surface source from where the particles are emitted
- Fluence: normalization by the total number of particle modelled, by the surface of the surface source from where the particles are emitted and by the energy spectrum of the source
Smart GRAS simulation control
Simulation control script generation and edition
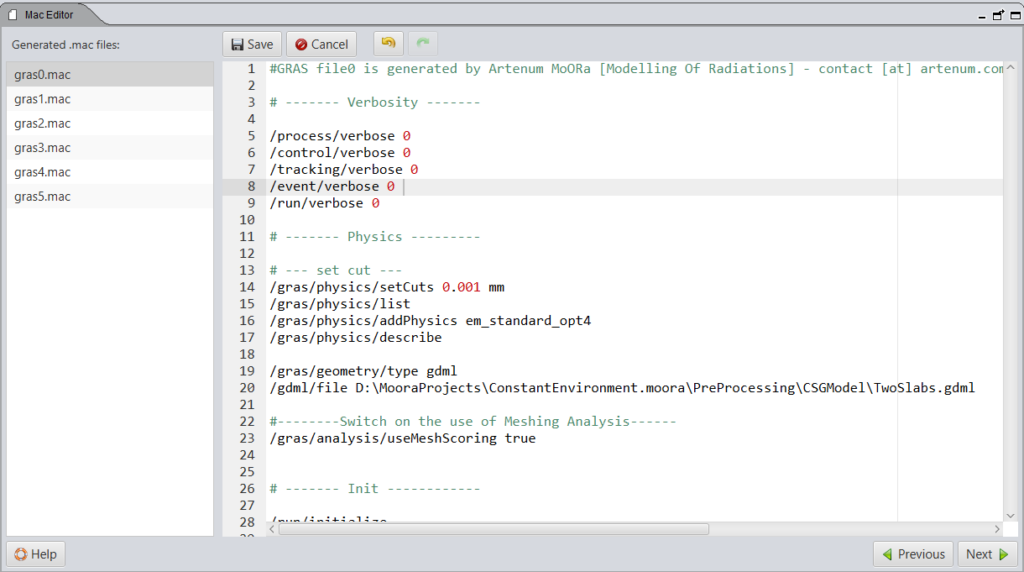
Using the inputs from the user, the software generates automatically a .mac file. This file is used to launch GRAS with the correct simulation parameters. The generated file is displayed in MoORa and can be edited by the user.
The .mac text editor contains several useful functionalities to help the user edit it:
- A syntactical colouration;
- Cancel/restore modifications;
- Cut, copy or paste text;
- Search and replace text;
- Text font size selection;
- Column selection;
- Entire line moving;
- …
Simulation live monitoring
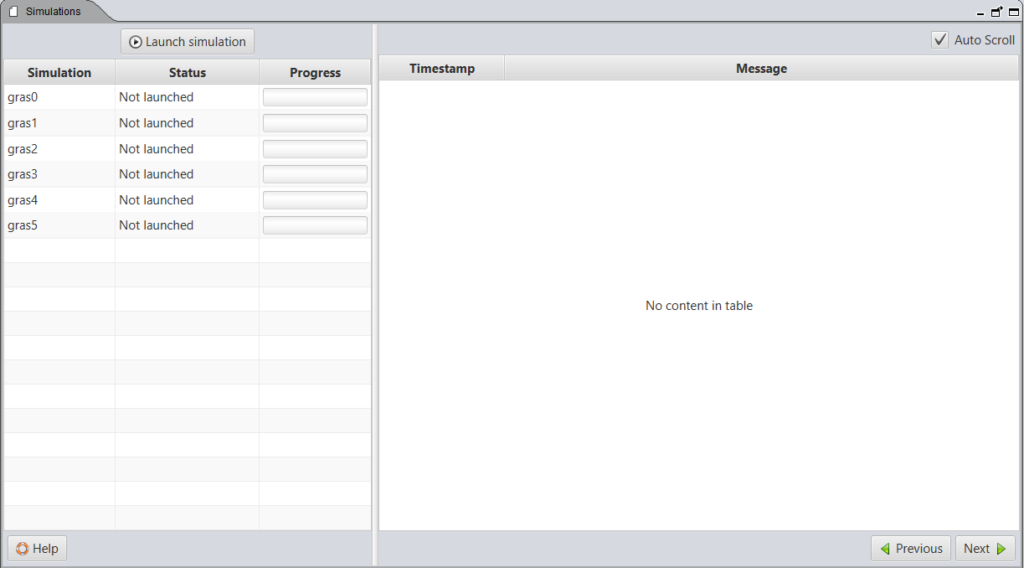
MoORa can drive smartly the GRAS kernel. MoORa facilitates the launching of simulation by correctly setting environment variables in order for GRAS to save the results inside the MoORa project to centralise the results and facilitate their extraction.
From within MoORa, the user can launch the GRAS execution and follow in real-time its evolution by two means: a log console displays the filtered log outputs of GRAS to display the more useful ones and a progress bar follows the number of emitted particles to display overall progression.
Results analysis and extraction
After the simulation completion, several result types are available inside MoORa, y = f(x) chart type, text output type and 3D view result type depending of the chosen output options (see On demand outputs).
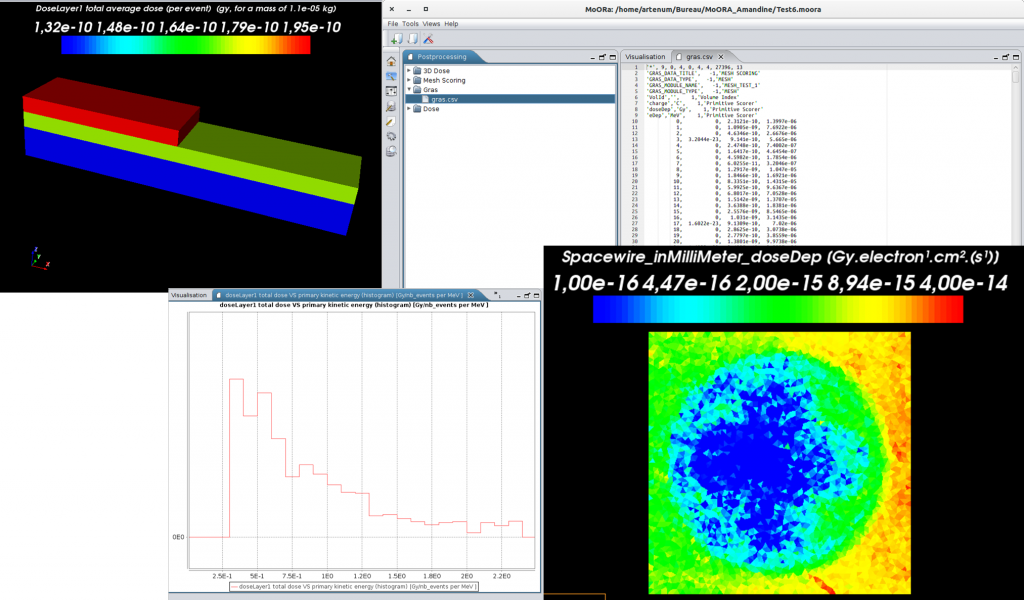
For the TID computation outputs, two types of results are available. A “doseResults.txt” file displays the computed dose inside each group of selected elements. From these files, MoORa extracts 3D results displaying the TID versus the primary kinetic energy for each volume inside the system geometry.
For the Gmsh scoring results, the computation of the deposited dose, charge and energy inside the meshing is available and can be visualised in 3D for each mesh.
A file – which is automatically generated by GRAS and contains all the raw outputs of GRAS – is available for advanced treatments. This file may contain outputs generated from manually added command lines in the .mac file. These results can also be visualised and exported with MoORa.
Interoperability
In the context of interoperability between software, EDGE can be used to define geometries needed as inputs of MoORa as detailled here.
Moreover, MoORa itself can be operated as an input of an internal charging software such as SPIS-IC.
Get the software
It is important to note that GRAS is open source and available on ESA website, upon registration.
The MoORa software itself can be obtained by contacting us.